How to Use Chart Events to Add Effects
Description
Pie slices can be "exploded" to add emphasis. Chart events can be used to dynamically explode pie slices in a Chart control when the chart is double-clicked. Events also be used to enhance a chart with effects such as popup help or additional details.
Chart events can be used to add effects, such as popup help or dynamically exploding a slice of a pie chart. To being, you must first enable chart events for the Chart control. This is done by checking the Has events property.
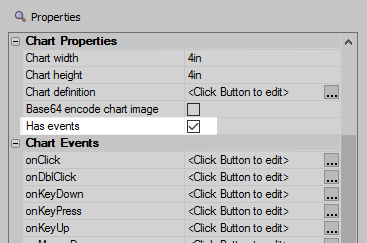
When Has events is enabled, it exposes the Chart Events available for the chart control. These events are mouse events that can be utilized to add effects or perform other actions when the user interacts with the Chart control.
How to Explode a Pie Slice when Chart is Double-Clicked
In some cases, you may want to add extra emphasis to a portion of data when the user double-clicks on the Chart. For example, suppose you want to explode a pie slice when the user double-clicks on the chart. In this example, we have created a Chart control that uses a Custom data source as defined below:
function piedata as c (e as p)

dim explodedSliceNumber as n = -1
if eval_valid("e.__javascriptFunctionResults") then
   dim data as p = json_parse(e.__javascriptFunctionResults)
   explodedSliceNumber = convert_type(data.javascriptFunctionResult, "N")
end if

if explodedSliceNumber >= 0 then
explodedSliceNumber = explodedSliceNumber + 1
end if

dim arr[0] as p
i = arr.append()
arr[i].sales = 10
arr[i].region = "East"
arr[i].exploded = 0

i = arr.append()
arr[i].sales = 20
arr[i].region = "West"
arr[i].exploded = 0

i = arr.append()
arr[i].sales = 15
arr[i].region = "South"
arr[i].exploded = 0

i = arr.append()
arr[i].sales = 8
arr[i].region = "North"
arr[i].exploded = 0

if explodedSliceNumber > 0 then
arr[explodedSliceNumber].exploded = 1
end if

dim txt as c
txt = arr.dump_properties("sales|region|exploded")

piedata = txt

end function
In the Custom data series that is created, a sub-series that defines the "exploded" state of a pie slice has been included. This allows us to use an expression to define the exploded property of a data point in the Chart as follows:
Series1.exploded = "1"
Before the Custom data series is calculated, a JavaScript function is called. The purpose of this function is to pass which pie slice was double-clicked to the Custom Xbasic function that calculates the data series. The value of the selected pie slice is defined in the e.__javascriptFunctionResults variable in the Xbasic function. The e.__javascriptFunctionResults holds the return value of the JavaScript function that is called, which is defined below:
function pieDataJs() {
    if (typeof {dialog.object}._exploded != 'undefined') {
        return {dialog.object}._exploded;
    } else {
        return -1;
    }
}
The variable, {dialog.object}._exploded is a value that is calculated in the Chart control's onDblClick event. In the onDblClick event, the chart.pointNumber is retrieved and stored in the variable {dialog.object}._exploded. chart.pointNumber indicates which pie slice in the data series was double-clicked. It is a zero-indexed value:
{dialog.object}._exploded = chart.pointNumber;
{dialog.Object}.refreshDataSeries('Series1');
var obj = {dialog.object}.getControl('c1');
obj.refresh();
After setting the {dialog.object}._exploded variable, the Chart control is refreshed. This triggers a call to the Xbasic function that defines the Chart's data series. When called, the exploded pie slice value is passed in and the data series that was double-clicked is given a value of "1" for it's "exploded" sub-series value.
For a detailed tutorial on how to explode a pie slice, watch the videos below:
Using Events to Create "Exploding" Pie Charts
Download Exploded Pie Component 1
Download Exploded Pie Component 2
See Also