How to Customize the Chart Control Background and Labels
Description
Several pre-configured themes are available for changing how a Chart control looks. Themes are great for many cases, however some effects can only be achieved by using CSS.
Discussion
The Chart control can be customized by adding classes to style the chart. The Chart Style builder allows you to customize the Chart control's appearance, including several themes and tools for customizing the layout, fonts and colors used in the Chart control.
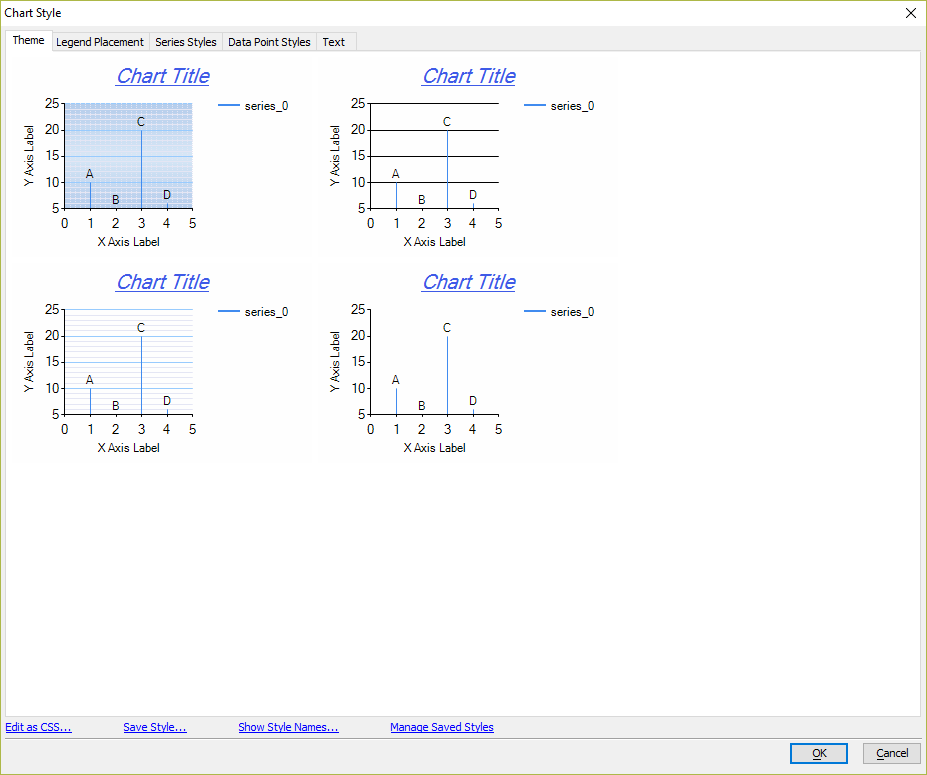
Changing the Style of the X-Axis Labels
The Chart Style builder can be used to customize the X-Axis and other text in the Chart control.
Open the Chart definition.
Open the Chart Style builder by clicking the
 button for the Chart style property.
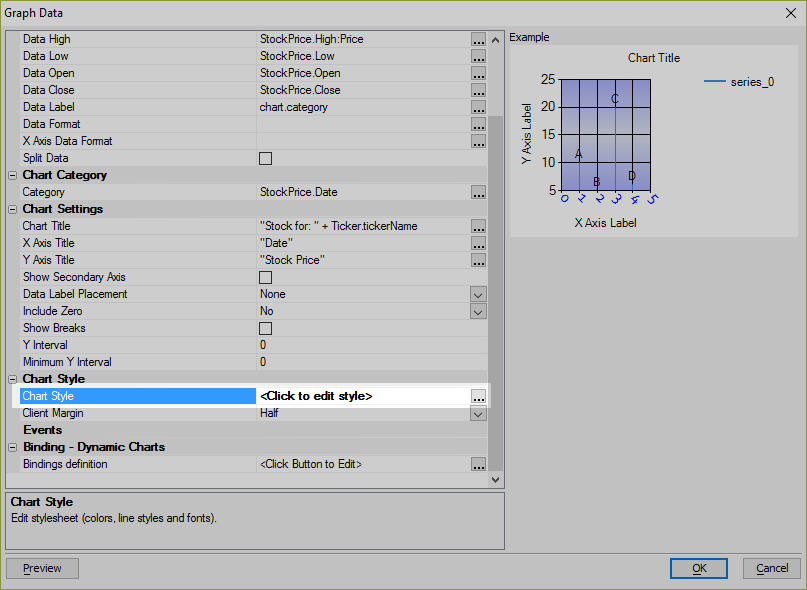
Click on the Text tab to open the Text Styles editor.
Customize the Font, Color, and Rotation Angle for the X-Axis.
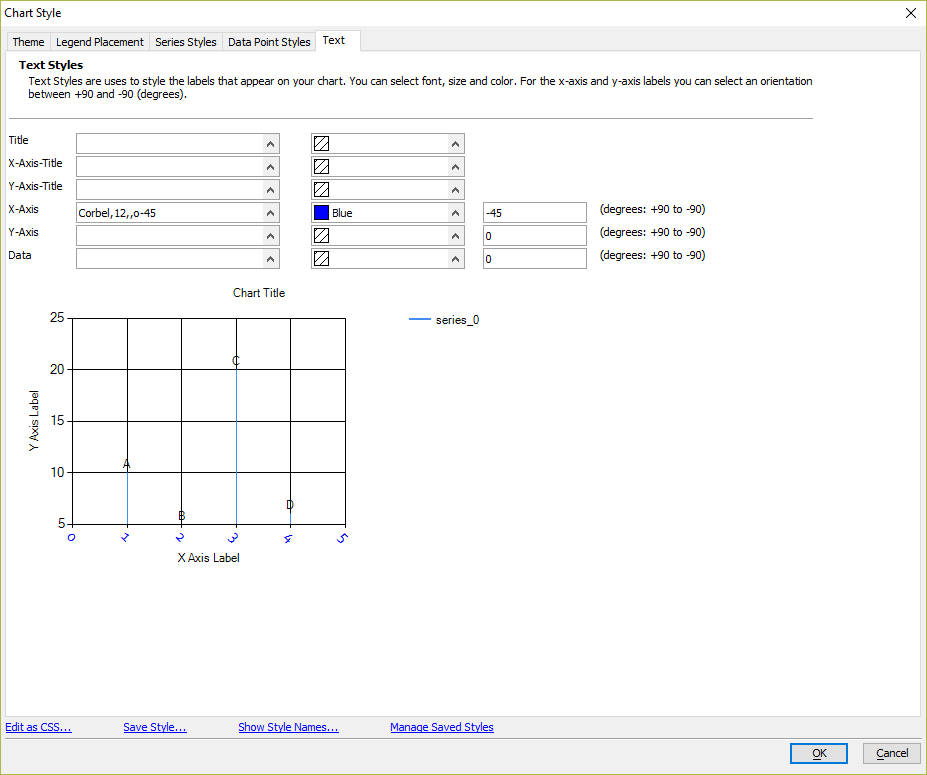 Chart control with an x-axis styled to use 12pt Corbel font that is blue and rotated -45 degrees
Save your changes.
Setting the Chart Background Color
Some aspects of the Chart control can only be configured using CSS, such as the chart's background color. To set the Chart control's background to a gradient fill, you must write your own CSS:
Open the Chart definition.
Open the Chart Style builder by clicking the
button for the Chart style property.Click the Edit as CSS... link at the bottom of the Theme tab.
Use the
 Add Selector tool on the Design tab to add the chart-client-area and create a gradient background fill for the Chart control using the Chart Style Builder.
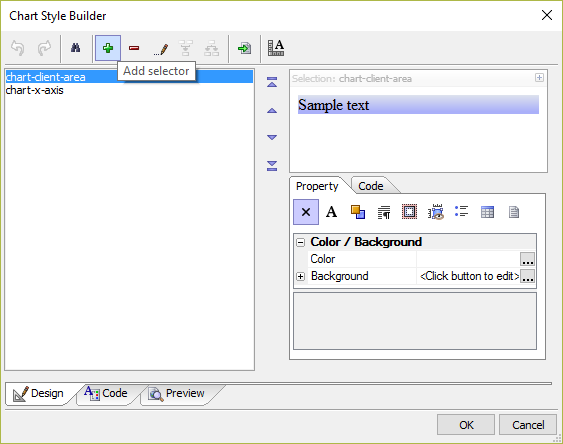
Save your changes.
For full step-by-step instructions on how to style the background and labels of a Chart control, watch the video below.
Customizing the Chart Background and Labels
See Also