How to Define Labels for Bars in Bar Charts
Description
The default behavior of using the data value for a bar chart labels can be changed.
Discussion
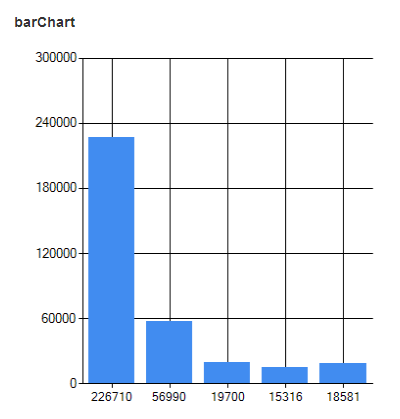
Labels can be added to data values for a Bar chart. By default, the bar chart will use the data value for its label. For example, consider the following data series, for which we would like to plot the population:
Country|Population
USA|226710
UK|56990
Canada|19700
Australia|15316
Other|18581
The bar chart shows the population totals for the series. However, displaying the population value is not useful. Instead, we'd like to show the country for the population.
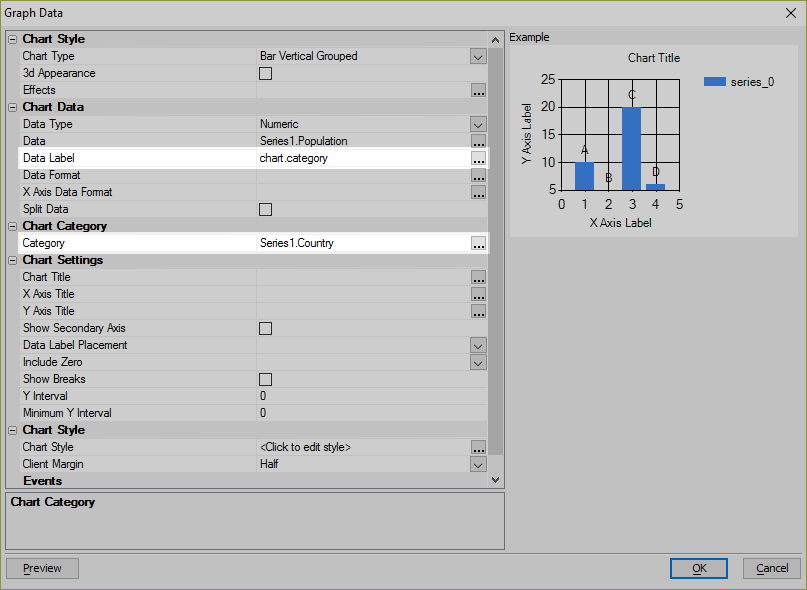
The label can be changed to use a different data series. The Data Label property for a server-side Chart control can be configured to use values other than the data value for the plotted series. This is done by setting the Data Label to chart.category and defining the Chart Category to use the Country sub-series.
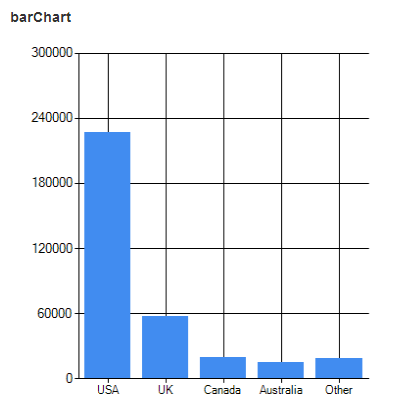
Now, when the bar chart is rendered, it will show the Country name instead of the value of the Population:
For complete step-by-step instructions on how the Chart control is configured to display a separate series as the labels for a bar chart, watch the video below:
Defining Labels for each Bar in a Bar Chart
By default, the label for each bar in a bar chart is the data value for the bar. In this video, we show how each bar can have a descriptive label.
See Also