How to Plot Multiple Data Series on a Single Chart
Description
Multiple data series can be plotted in one Chart control, either as one chart type or using several chart types.
Discussion
The Chart control can be configured to plot multiple data series as separate charts in the Chart control. The individual charts can be rendered as the same type (such as a bar or line chart) or as a combination of chart types - e.g. a bar chart with a trendline.
You can plot as many series as you want in the Chart control. Each series to plot is added using the Data property. The style of each Data series can be modified using the Chart Style builder. In the Chart Style builder, you can define the Chart Type and appearance of each data series independently of other series in the Chart control. For example, in a vertical bar chart that displays monthly temperatures, you can plot the "Record High" data series as a Line chart follows:
Plotting Series Using Different Chart Types
Open the Chart definition.
Open the Chart Style builder by clicking the
 button for the Chart style property.
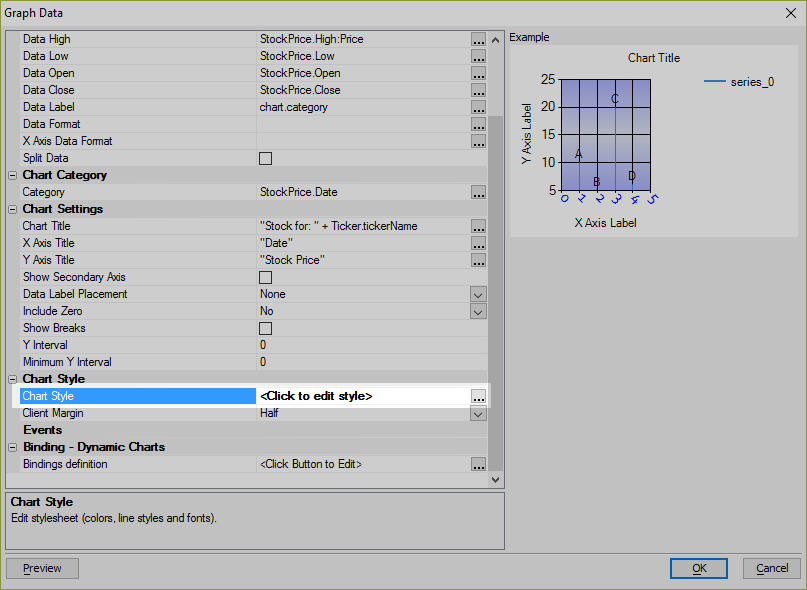
On the Series Styles tab, select the desired Chart Type for the data series.
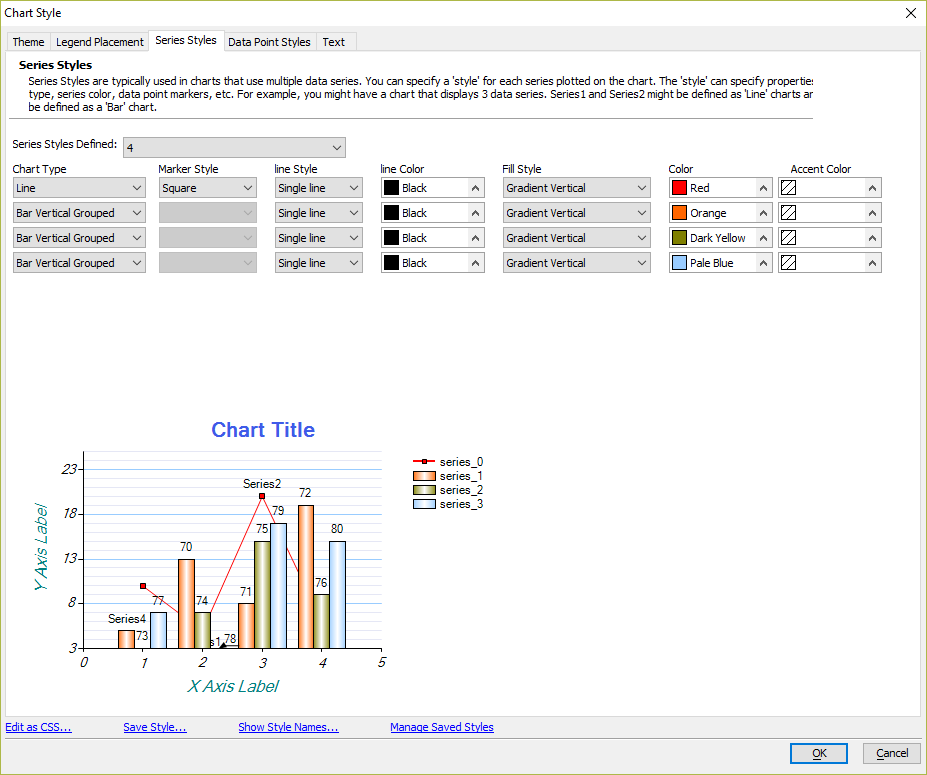 Series 1 configured to render "Record High" temperature data as a "Line" chart
Save your changes.
For full step by step instructions on how to add multiple series to a Chart control and configure series to use different chart types, watch the videos below:
Plotting Multiple Data Series on a Single Chart
See Also