How to Plot Time Series
Description
Alpha Anywhere's server-side charting controls will evenly distribute date and time series when plotting the data, even if the series is missing intermediate dates.
Discussion
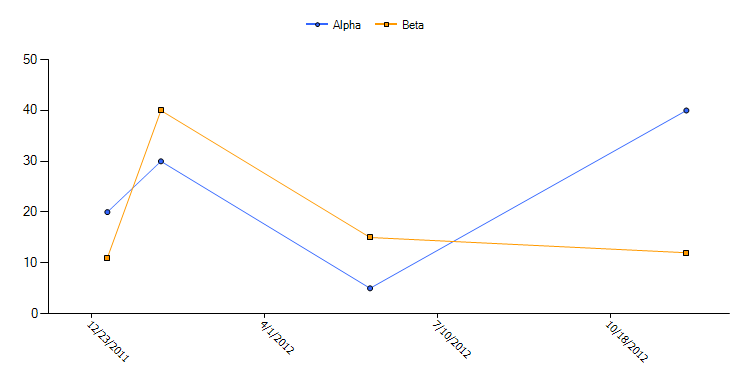
Charts can be created using date or time series. The data or time data does not need to be complete. For example, suppose you have the following data series:
time|value|value2
{1/1/2012}|20|11
{2/1/2012}|30|40
{6/1/2012}|5|15
{12/1/2012}|40|12
Date and time data series do not need to be complete in order to plot the series. Alpha Anywhere will plot date and time data series proportionally:
To learn how to plot date and time series using a server-side Chart control, watch the video below:
Plotting Time Series Values - Dates and Times
In some cases the data points that you want to plot on a chart are associated with specific date or date/time values. This video shows how XY type charts can be used to plot time and date values.
See Also
