How to Write a Charting Application For a Web Service
Description
Charts can be created based on data from a Web Service. Using Xbasic callbacks, data from a web service such as Yahoo! Finance can be retrieved and used to populate a data series in a Chart control.
Discussion
When defining the data series for a Chart control in a UX Component, an Xbasic function can be called to populate the data series. The Xbasic function can make an HTTP request to retrieve data from a third-part web service using the http_get_page2() method. This data can be used to populate a Chart control with a little bit of work to transform the data into a format the Chart control expects.
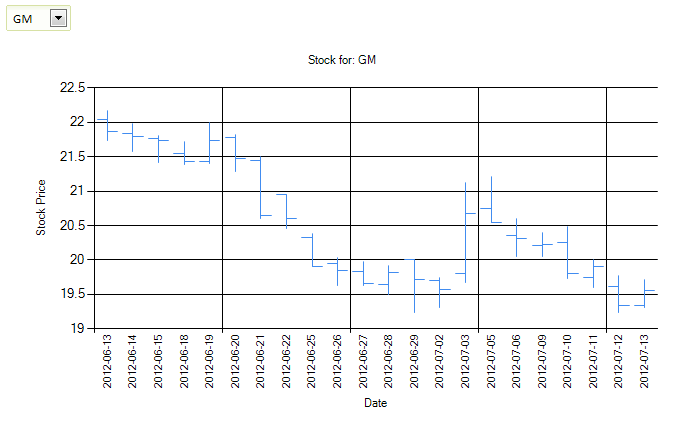
For example, supposed you wanted to display stock information retrieved from Yahoo! Finance to populate a high-low-close chart. In order to populate the chart with stock data from Yahoo!, the data received from the web service needs to be formatted so the Chart control can read the data series:
dim url as c = "http://ichart.finance.yahoo.com/table.csv?a="+month+"&b="+dayNumber+"&c="+year+"&s="+ticker
dim data as c = http_get_page2(url)

'data returned by yahoo is chr(10) delimited, not crlf delimited!
'data is returned with newest data on top. we want oldest data on top, so sort the data.
data = word(data,2,chr(10),999999)
data = strtran(data,",","|")
data = sortsubstr(data,chr(10),"A")
With the data in the correct format, the Chart control can render the stock information:
For detailed information about how the stock chart was created and populated dynamically with data from Yahoo! Finance, watch the videos below:
- Calling a Simple Web Service to Get Chart Data - Stock Price Example Part 1
- Calling a Simple Web Service to Get Chart Data - Stock Price Example Part 2
Click here to download the component used in the videos above.
Yahoo Finance API Discontinued
As of May 2017, the Yahoo Finance API used in this example is no longer available. The get_series function shown in the videos above has been rewritten to use the Alpha Vantage API. The function below demonstrates how to use the Alpha Vantage API to accomplish the same result as the Yahoo Finance API.
This example shows how to format the JSON data received from the Alpha Vantage API into the data series format expected by the chart control shown in the videos above.
function get_series as c(e as p)
	dim ticker as c = "GM"

	if eval_valid("e.dataSubmitted.TICKER") then
		ticker = e.dataSubmitted.TICKER
	end if

	dim dt as d = date()
	dim yearN as n = year(dt)
	dim monthN as n = month(dt)
	dim dayN as n = day(dt)
	if monthN <= 0 then
		monthN = 12
		yearN = yearN-1
	else
		monthN= monthN-1
	end if
	dim year as c = ""+yearN
	dim month as c = ""+monthN
	dim dayNumber as c = ""+dayN

	dt = ctod(year+"-"+month+"-"+dayNumber)

	'' Get your API Key at www.alphavantage.co
	'' Replace "YOURAPIKEY" in the text below with your API key:
	dim url as c = "https://www.alphavantage.co/query?apikey=YOURAPIKEY&function=TIME_SERIES_DAILY_ADJUSTED&symbol="+ticker
	dim json as c = http_get_page2(url)

	dim jso as extension::JSON
	jso.setJson(json)
	jso = jso.getIndexed(1)

	dim arr[8] as c
	dim data as c = ""
	dim count1 as n = jso.getLength()

	for index1 = 0 to count1-1
		dim tickerDate as c = jso.nameIndexed(index1)
		if (ctod(tickerDate) < dt)
			exit for
		end if

		dim jsf as extension::JSON
		jsf = jso.getIndexed(index1)

		dim count as n = jsf.getLength()
		for index = 0 to count-1
			dim name as c = jsf.nameIndexed(index)
			arr[index+1] = jsf.getProperty(name)
		next

		'Date,Open,High,Low,Close,Volume,AdjClose
		data = data+tickerDate+"|"+arr[1]+"|"+arr[2]+"|"+arr[3]+"|"+arr[4]+"|"+arr[6]+"|"+arr[5]+crlf()
	next

	data = sortsubstr(data,chr(10),"A")

	get_series = data
end function
Alternatively, download this updated Stock Chart component which shows how to get the data from the Alpha Vantage API in CSV format.
Alpha Vantage requires an API key in order to use their web service. Click here to get your API key from Alpha Vantage.
See Also