Google Map Method (UX Component)
- Resize Map
- Map Actions
- Map Action Properties
- Add Multiple Markers Properties
- Javascript Properties
- Remove Marker(s) Properties
- Emphasize/De-emphasize Markers Properties
- Zoom Map Properties
- Center Map Properties
- Location or Address Properties
- Show/hide Marker Properties
- Show Detail Properties
- Add Marker Properties
- Resize Map Properties
- Plot Route
- Get distance and travel time between points
- Videos
Description
Call a method to perform some action on a Google Map. Actions that you can perform include removing markers, toggling display of an info box, adding a marker, centering the map on an address, plotting directions, and more.
To perform an action on a map in a Grid, see Google Map Method.
Resize Map
An option in the 'Google Map Methods (UX Component)' action allows you to resize the map. You can set the map height and width to an explicit size, or you can read the size from controls on the component, or you can call a Javascript function that returns the height and width.
Map Actions
This action allows you to perform these map actions:
- Add a marker to the map - (Watch "Adding a Marker to a Map" in Videos to learn more.)
- Add multiple markers to the map - (Watch "Adding Multiple Markers to a Map" in Videos to learn more.)
- Show marker detail (i.e. open the Info Box)
- Show/hide marker
- Remove marker(s)
- Center map
- Set zoom level
- Emphasize/De-emphasize markers
- Refresh map
- Add KML Layers to a map
- Plot route
- Get distance and travel time between two points - Computes the distance and travel time between destinations in an array of two or more locations.
- Get a pointer to the Google Map object - Allows you to get a pointer to the underlying Google Maps object. Useful if you are trying to implement some code you found while reading the Google Maps API documentation.
Map Action Properties
- Map id
Specify the map you want to operate on.
- Action name
Specify the action that you want to perform. Choices include:
- Add a marker to the map
- Add multiple markers to the map
- Show marker detail (i.e. open the Info Box)
- Show/hide marker
- Remove marker(s)
- Center map
- Set zoom level
- Refresh map
- Emphasize/De-emphasize markers
- Resize map
- Add KML Layers to map
- Plot route
- Get pointer to Google Map object
- Get distance and travel time between two points
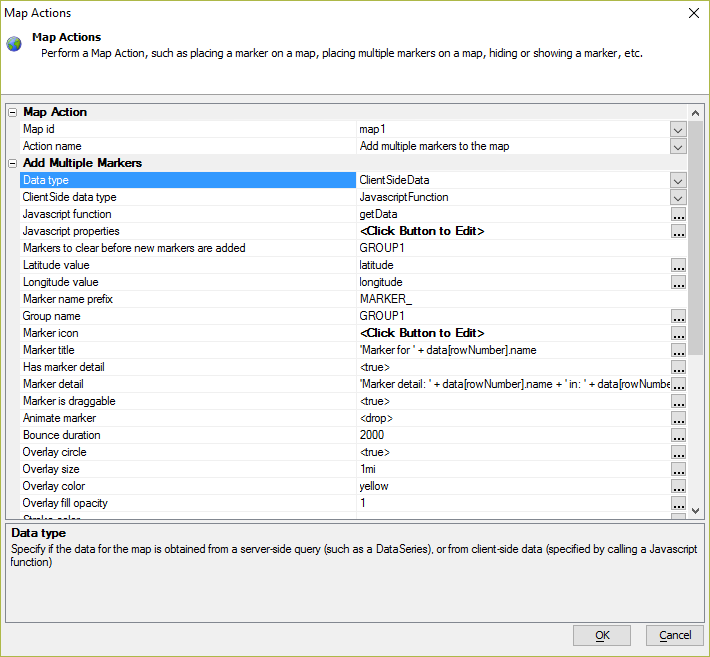
Add Multiple Markers Properties
- Data type
Specify if the data for the map is obtained from a server-side query (such as a Data Series), or from client-side data (specified by calling a JavaScript function.) Choices are ServerSideData or ClientSideData.
- ClientSide data type
The client-side data source to read location data to add markers to the map. This property is only available if ClientSideData is selected for Data type. Choices are JavascriptFunction or ListControl.
- Javascript function
The JavaScript function to call to get the locations to add to the map. The function must return an array of objects. Each object in the array must have a latitude and longitude value. Other values can optionally be specified.
- Javascript properties
Defines the properties in the array of objects returned by the function specified in the Javascript function property.
- List control
The List control in the UX component that contains the locations to add to the map. The specified List control must have a "latitude" and "longitude" field that contains the location to add to the map.
- Data series name
Specify the name of the Data Series that contains the data for the markers. To define Data Series, go to the Properties Pane.
- Markers to clear before new markers are added
Specify the Group Names of any marker groups you want to clear from the map before adding new markers.
- Latitude value
Specify the name of the sub-series that has the latitude value
- Longitude value
Specify the name of the sub-series that has the longitude value
- Marker name prefix
Each marker is given a unique name based on the marker name prefix and the row number in the Data Series.
- Group name
Specify the group name that each marker belongs to. The group name is a plain text value (it does not support HTML markup). If you want to include data from the Data Series in the name, use a template. Click the
 smart field button to define the template.
If Data type is set to ServerSideData, the Group name is specified as static text that can include Xbasic placeholders.
If Data type is set to ClientSideData, the Group name is specified as a JavaScript expression.
See Marker detail below for more information about templates.
- Marker icon
If you leave this blank a default icon will be used for all markers. You can customize the icon used for each marker on the map. For example, you can dynamically set the icon based on an expression or an 'icon sequence'.
If you specify an expression for the marker icon and Data type is set to ServerSide, the expression uses Xbasic syntax (.AND., .OR., .NOT., =, <>). Otherwise, if Data type is set to ClientSide, the expression uses JavaScript syntax (&&, ||, !, ==, !=).
You can also create a function to set the icon. The function will be passed the data in the current row in the data set and the row number. You can reference this data in your code to determine what image to use. The function must the name of the marker image to use.
The function will either be an Xbasic or JavaScript function based on the Data type setting.
If Data type is set to ServerSide, the function will be an Xbasic function. The marker data and row number are passed in the e argument to the function:
- Variable
- Description
- e.tbl
A pointer to the Data Series value for the current row in the Data Series. To get the value of a specific field in the data, use the data() method. See example below.
- e.rowNumber
The current row in the Data Series.
For example, the function below computes the image to return based on the value of "quantity":
function getMarkerIcon as c (e as p)
    dim imageName as c

    if (val(e.tbl.data("quantity")) < 100) then
        imageName = "image1.jpg"
    else if (val(e.tbl.data("quantity")) >= 100 .and. val(e.tbl.data("quantity"))) < 200 then
        imageName = "image2.jpg"
    else
        imageName = "image3.jpg"
    end if

    getMarkerIcon = imageName

end function
If Data type is set to ClientSide, the function will be a JavaScript function. The marker data and row number are passed as arguments to the function:
- Variable
- Description
- markerData
An object that contains the data for the current row.
- rowNumber
The current row number.
The JavaScript function must return a value that will contain the name of the image to use for the map marker for the current row of data object.
For example:
function getMarkerIcon(markerData,rowNumber) { var imageName = "" if (markerData.quantity < 100) { imageName = "image1.jpg" } else if (markerData.quantity >= 100 && markerData.quantity < 200) { imageName = "image2.jpg" } else { imageName = "image3.jpg" } return imageName; }- Marker title
Specify the marker title. The marker title is a plain text value (it does not support HTML markup). If you want to include data from the Data Series in the title, use a template. Click the
smart field button to define the template.If Data type is set to ServerSideData, the Marker title is specified as static text that can include Xbasic placeholders.
If Data type is set to ClientSideData, the Marker title is specified as a JavaScript expression.
See Marker detail below for more information about templates.
- Has marker detail
Specify if each marker has a detail view. Specify '<true>', '<false>' or the name of a Data Series column that has a logical value.
- Marker detail
Specify the HTML for the marker detail. If you want to include data from the Data Series in the detail, use a template. Click the
smart field button to define the template.The marker detail is only shown if Has marker detail is set to <true>
If the Data Type is set to ServerSideData, the template can contain static text and Xbasic expressions, which are enclosed in curly braces. Xbasic expressions can include Xbasic functions.
A simple template with no expressions.GroupName
A template that references the row number in the data series.GroupName{rowNumber}The template can reference one or more values from the data series. For example, the template below includes the Name, Latitude, and Longitude columns from a Data Series:
Showing marker for {ds.data("Name")}<br>Latitude: {ds.data("Latitude")}<br>Longitude: {ds.data("Longitude")}Your template can use Xbasic Functions from the Xbasic Function Library. For example, the template below uses the UT() function to format the Name:
Showing marker for {UT(ds.data("Name"))}<br>Latitude: {ds.data("Latitude")}<br>Longitude: {ds.data("Longitude")}You can also use functions defined in the Xbasic Functions section of the component. The function name must be prefixed with lf. in order to use the function. For example:
Showing marker for {lf.myXBFunction(ds.data("Name"))}<br>Latitude: {ds.data("Latitude")}<br>Longitude: {ds.data("Longitude")}If the Data Type is set to ClientSideData, the template is defined as a JavaScript expression. The JavaScript expression must evaluate to a string. Any HTML you would like to include in the template must be specified as strings. For example:
A simple expression'GroupName'
Here is a slightly more complex JavaScript expression that includes the row number:
'GroupName' + rowNumber
The template can include both static HTML text and data from the JavaScript array used to populate the map. The expression below references the Name, Latitude, and Longitude values in the map data:
'Showing marker for ' + data[rowNumber].Name + '<br>Latitude: ' + data[rowNumber].Latitude + '<br>Longitude: ' + data[rowNumber].Longitude
You can the InsertMethod or Placeholder link to insert UX Component methods and placeholders in your JavaScript template.
Your template can also include JavaScript functions:
'Showing marker for ' + data[rowNumber].Name.toCase('s') + '<br>Latitude: ' + data[rowNumber].Latitude + '<br>Longitude: ' + data[rowNumber].LongitudeYou can also use your own functions. For example, the template below calls a JavaScript function (defined in the Javascript functions section of the component) that compute the HTML to display, passing it the data for the current marker:
Call JavaScript function to compute the HTML for the detail.computeMarkerDetail(data[rowNumber])
- Marker is draggable
Specify if each marker is draggable. Specify '<true>', '<false>' or the name of a Data Series column that has a logical value.
- Animate marker
Specify if each marker should be animated when placed on the map. Specify '<false>', '<drop>' or '<bounce>', or the name of a Data Series column that has 'drop', 'bounce' or 'false' as a value.
- Bounce duration
If the maker animation is set to 'drop' specify the length of the animation in milliseconds. You can select a Data Series column that has a duration value.
- Overlay circle
Specify if a circle should be drawn around each marker. Select <true>, <false> or the name of a Data Series column that returns a logical value.
- Overlay size
Specify the overlay size either by specifying a radius or area. Enter a number with the following suffix: "m", "km", "mi", or "ft" for radius, and "sq m", "sq km", "sq mi", "sq ft" for area. Alternatively, select a Data Series column that contains the overlay size.
- Overlay color
Specify the overlay color. Alternatively, select a Data Series column that contains the overlay color.
- Overlay fill opacity
Specify the overlay fill opacity (a value between 0 and 1 - solid color). Alternatively, select a Data Series column that contains the overlay fill opacity.
- Stroke color
Specify the stroke color (color of the line surrounding the circle). Alternatively, select a Data Series column that contains the stroke color.
- Stroke opacity
Specify the stroke opacity (a value between 0 and 1 - solid color). Alternatively, select a Data Series column that contains the stroke opacity.
- Stroke width
Specify the stroke width (in points). Alternatively, select a Data Series column that contains the stroke width.
Adding Multiple Markers to a Map Control Using Client-side Data
The data that defines the latitude/longitude for each marker on the map (and also for the marker titles, details etc). can be specified using client-side data. Client-side data can come from a Javascript function, a List control, the client-side Data Cache, or, in the case of a Cordova application, by querying a SQLite database on a device.
To specify that the Google Map Method (UX Component) / Add multiple markers to the map action should use client-side data, set the Data type property to ClientSideData. You can then specify whether the client-side data comes from a Javascript function, or from data in a List control.
In the case where you specify the name of a Javascript function, you specify the name of a Javascript function (which must return an array of objects - each object has properties that must include the marker latitude and longitude values). You must also specify the names of the properties in the data returned by the Javascript function.
For example, assume that you specify the name of a Javascript function that returns data like this:
[
    {
        "name": "COYOTE FLATS",
        "city": "BISHOP",
        "state": "CA",
        "latitude": "37.20203",
        "longitude": "-118.47629"
    },
    {
        "name": "LOST HILLS SHERIFF\\'S STATION",
        "city": "CALABASAS",
        "state": "CA",
        "latitude": "34.14167",
        "longitude": "-118.5262"
    },
    {
        "name": "GOLDSTONE /GTS/",
        "city": "BARSTOW",
        "state": "CA",
        "latitude": "35.35053",
        "longitude": "-116.88837"
    }
]
In this case the property names that you specify in the Javascript properties property would be:
name
city
state
latitude
longitude
Loading Locations from the Client-Side Data Cache
If you want to use data from the client-side Data Cache, or (in the case of a Cordova application) data from a query against a SQLite database, you need to use a two-step process because reading data from a Data Cache (or a SQLite database) is an asynchronous action. Therefore your Javascript must read the Data Cache, or execute the SQLite query (you can use Action Javascript for this) and in the on success function for the action, you must put the data you have just read into a variable in the UX object (for example {dialog.object}._mapData) and then call the Action Javascript action to add the markers to a map using the Javascript function option. The Javascript function will read the data from the variable that contains the data.
For more information, watch "Adding Multiple Markers to a Map Control using Client-side Data" in the Videos below.
Javascript Properties
- onClick
Specify the Javascript to execute for this event. You will typically specify the name of a Javascript function. You can pass in any data you want to the function from the Data Series. You can also pass in data (no quotes) which is the Google Maps 'data' object for the marker. Example: myFunction(data,'{ds.data("Name")}') Tip: You can get the lat/lng of the event location from the 'data' object. For example: var lat = data.latLng.lat(), var lng = data.latLnd.lng()
- onDblClick
Specify the Javascript to execute for this event. You will typically specify the name of a Javascript function. You can pass in any data you want to the function from the Data Series. You can also pass in data (no quotes) which is the Google Maps 'data' object for the marker. Example: myFunction(data,'{ds.data("Name")}') Tip: You can get the lat/lng of the event location from the 'data' object. For example: var lat = data.latLng.lat(), var lng = data.latLnd.lng()
- onDrag
Specify the Javascript to execute for this event. You will typically specify the name of a Javascript function. You can pass in any data you want to the function from the Data Series. You can also pass in data (no quotes) which is the Google Maps 'data' object for the marker. Example: myFunction(data,'{ds.data("Name")}') Tip: You can get the lat/lng of the event location from the 'data' object. For example: var lat = data.latLng.lat(), var lng = data.latLnd.lng()
- onDragEnd
Specify the Javascript to execute for this event. You will typically specify the name of a Javascript function. You can pass in any data you want to the function from the Data Series. You can also pass in data (no quotes) which is the Google Maps 'data' object for the marker. Example: myFunction(data,'{ds.data("Name")}') Tip: You can get the lat/lng of the event location from the 'data' object. For example: var lat = data.latLng.lat(), var lng = data.latLnd.lng()
- onDragStart
Specify the Javascript to execute for this event. You will typically specify the name of a Javascript function. You can pass in any data you want to the function from the Data Series. You can also pass in data (no quotes) which is the Google Maps 'data' object for the marker. Example: myFunction(data,'{ds.data("Name")}') Tip: You can get the lat/lng of the event location from the 'data' object. For example: var lat = data.latLng.lat(), var lng = data.latLnd.lng()
- onMouseDown
Specify the Javascript to execute for this event. You will typically specify the name of a Javascript function. You can pass in any data you want to the function from the Data Series. You can also pass in data (no quotes) which is the Google Maps 'data' object for the marker. Example: myFunction(data,'{ds.data("Name")}') Tip: You can get the lat/lng of the event location from the 'data' object. For example: var lat = data.latLng.lat(), var lng = data.latLnd.lng()
- onMouseOut
Specify the Javascript to execute for this event. You will typically specify the name of a Javascript function. You can pass in any data you want to the function from the Data Series. You can also pass in data (no quotes) which is the Google Maps 'data' object for the marker. Example: myFunction(data,'{ds.data("Name")}') Tip: You can get the lat/lng of the event location from the 'data' object. For example: var lat = data.latLng.lat(), var lng = data.latLnd.lng()
- onMouseOver
Specify the Javascript to execute for this event. You will typically specify the name of a Javascript function. You can pass in any data you want to the function from the Data Series. You can also pass in data (no quotes) which is the Google Maps 'data' object for the marker. Example: myFunction(data,'{ds.data("Name")}') Tip: You can get the lat/lng of the event location from the 'data' object. For example: var lat = data.latLng.lat(), var lng = data.latLnd.lng()
- onMouseUp
Specify the Javascript to execute for this event. You will typically specify the name of a Javascript function. You can pass in any data you want to the function from the Data Series. You can also pass in data (no quotes) which is the Google Maps 'data' object for the marker. Example: myFunction(data,'{ds.data("Name")}') Tip: You can get the lat/lng of the event location from the 'data' object. For example: var lat = data.latLng.lat(), var lng = data.latLnd.lng()
- onRightClick
Specify the Javascript to execute for this event. You will typically specify the name of a Javascript function. You can pass in any data you want to the function from the Data Series. You can also pass in data (no quotes) which is the Google Maps 'data' object for the marker. Example: myFunction(data,'{ds.data("Name")}') Tip: You can get the lat/lng of the event location from the 'data' object. For example: var lat = data.latLng.lat(), var lng = data.latLnd.lng()
- onAddComplete
Specify the Javascript to execute for this event. You will typically specify the name of a Javascript function. You can pass in any data you want to the function from the Data Series. You can also pass in markerSettings and markerObject (no quotes, case sensitive) which are the settings for the marker and the Google Maps marker Object. Example: myFunction(markerSettings,markerObject,'{ds.data("Name")}')
Remove Marker(s) Properties
- Remove by what
Remove a specific marker or a group of markers. Choices include Marker, Group.
- Marker name
Specify the marker name.
- Marker group
Specify the marker group.
Emphasize/De-emphasize Markers Properties
- Emphasize or de-emphasize
Specify if you want to emphasize or de-emphasize a markers. Choices include Emphasize, De-Emphasize.
- Specify markers by
How do you want to specify the markers to emphasize/de-emphasize? You can either specify by marker name or marker group. Choices include By Name, By Group.
- Emphasize duration
Enter the duration in milliseconds
- Marker names
Enter a comma delimited list of marker names.
- Marker groups
Enter a comma delimited list of marker group names.
Zoom Map Properties
- Zoom level
Set the zoom level (0 - whole earth - 20 - a few yards)
Center Map Properties
- Marker name
Specify the name of the marker. To call a javascript function to return the map name, specify javascript:functionname
- Pan map
Indicate if the map should be panned into view.
Location or Address Properties
- Get location or address from
Specify where the address of the marker should be obtained from. 'Explicit' - an address or lat/lng you enter now, 'Control(s) on component' - read a lat/lng value, or an address from one or more controls on the component, 'Javascript Function' - the name of a Javascript function that will return the location (either an address, or a lat,lng value), 'List Control' - columns in a List Control that contain either lat/lng values or an address, 'Device Location' - read the location from the device (the user will be prompted for permission). Choices include Explicit, Control(s) on Component, List Control, Javascript Function, Device Location.
- High accuracy
If true, the device will use its most accurate method to get location information. If false, the device will use its fastest or lower power consumption method depending on the device.
- Timeout
The amount of time in milliseconds to wait on the device to acquire location information excluding the amount of time it takes the user to grant the web page access to geolocation data.
- Max age
The amount of time in milliseconds to accept a previously acquired location. 0 means that a new location must be acquired from the device.
- Location or Address
Specify the marker location. You can either enter an address, or a lat/lng value (as a comma delimited value e.g. 34,-118) .
- Control for latitude
Specify the name of the control to read for the latitude value.
- Control for longitude
Specify the name of the control to read for the longitude value.
- Control(s) to read
Specify the name of the control(s) to read. The control(s) can either contain an address or a lat/lng value (as a comma delimited value e.g. 34,-118).
- Javascript function
Specify the name of the Javascript function to call. The function can either return an address, or a lat/lng value (as lat,lng).
- List control
Specify the name of the List control
- List control column(s) to read
Specify the List column(s) to read. The list column(s) can either contain lat/lng values or an address.
- Latitude column
Specify the name of the column in the List that has the latitude value.
- Longitude column
Specify the name of the column in the List that has the longitude value.
- Data type
Specify if the value for the marker position is an address, or a latitude/longitude value. Choices include Address, Latitude/Longitude.
Show/hide Marker Properties
- Marker name
Specify the name of the marker. To call a javascript function to return the map name, specify javascript:functionname
- Marker state
Specify if the marker should be shown or hidden Choices include Show, Hide.
Show Detail Properties
- Marker name
Specify the name of the marker. To call a javascript function to return the map name, specify javascript:functionname
Add Marker Properties
- Marker settings
Marker settings property.
- Marker name
When you add a marker to a map you must specify a unique name for the marker. To call a javascript function to return the map name, specify javascript:functionname
- Bring marker into view
Specify if the map should be scrolled to bring the marker into view after it has been added to the map.
Resize Map Properties
- Map height
Specify the map height. Use CSS syntax. You can specify the name of a control from which the height should be read. If you want to specify an explicit value, then prefix the value with 'value:' (e.g. value:300px). You can also specify the name of a Javascript function that will return the height by prefixing the value with 'javascript:' (e.g. javascript:getHeight).
- Map width
Specify the map width. Use CSS syntax. You can specify the name of a control from which the width should be read. If you want to specify an explicit value, then prefix the value with 'value:' (e.g. value:300px). You can also specify the name of a Javascript function that will return the width by prefixing the value with 'javascript:' (e.g. javascript:getwidth).
Plot Route
The following properties are used to configure the Plot route action:
- Type
The type of route to plot:
- StartAndEndAddress
Plot a route between two locations: a start address and end address.
- MultipleAddresses
Plot a route for two or more addresses defined using a JavaScript function.
- Start address
This property is only shown when Type is "StartAndEndAddress".
The starting address for the route. You can either enter address (e.g. '36 Bigelow St. Cambridge MA') or latitude/longitude values (comma delimited (e.g. 42.3685632,-71.1045822). You can also specify the name of a Javascript function to return the address. To use a Javascript function, specify the address as: javascript:name_of_your_function
- End address
This property is only shown when Type is "StartAndEndAddress".
The end address for the route. See Start address for how to specify the address.
- Addresses
This property is only shown when Type is "MultipleAddresses".
The name of the JavaScript function to call that computes a list of addresses for the route. The addresses should be returned as an array. Each entry in the array can be either an address or latitude/longitude value. Latitude/longitude values must be comma delimited. For example, '42.480572,-71.204212'. Click here to download an example component that uses a List to populate the addresses.
- Draggable
If enabled, locations in the route can be moved by dragging them on the map.
- Travel mode
The travel mode to use. Can be "Driving", "Walking", or "Bicycling".
- Units
The distance units to use. Can be "Default", "Imperial", or "Metric".
- Avoid highways
If checked, highways will be avoided when the route is generated.
- Avoid tolls
If checked, toll booths and toll roads will be avoided when the route is generated.
- Placeholder or DIV Id for directions
Defines a placeholder where the directions should be shown. You can either specify a Placeholder control, or a DIV id. To specify a DIV id use this syntax: {div}name_of_div - i.e. prefix the DIV id with {div}. (for example {div}mydiv1)
- onGotRoute event
This property is only shown when Type is "MultipleAddresses".
Fires when the route information is available.
The onGotRoute event can be used to perform additional processing with the route data when it's received using JavaScript. Your code can reference an object called routeData. routeData has these properties:
- Property
- Description
- start
The latitude/longitude of the route starting point.
- end
The latitude/longitude of the route ending point.
- waypoints
An object with these properties:
- order
An array with the optimized order of the waypoints - if 'Optimize route waypoints' on the map is not checked then this array is in the same order as the addressed that are passed in.
- original
An array with the original order of the waypoints.
- plotted
An array with the optimized order of the waypoints.
Get distance and travel time between points
This action takes a set of two or more addresses (either strings or longitude/latitude values) and computes the distance and travel time between each set of points in the array. You can either pass in a start and end address or multiple addresses. In the case where you select MultipleAddresses you must specify the name of a Javascript function that will return an array of addresses. For example, if your function returns an array with these addresses:
['address1','address2','address3']
the action will compute the distance and travel time between:
- address1 - address2
- address2 - address2
The action is asynchronous, so when all values have been computed, a callback function is called. You can specify the JavaScript to execute in the callback function in the onReady Javascript property.
In your JavaScript you can reference an array called data that has an item for each address pair. Each item in the array has these properties:
- distance_value - distance in meters
- distance_text - string show distance in the specified units
- duration_text - string showing travel time
- duration_value - travel time in minutes
In addition you can reference these variables:
- total_distance_value - total distance between first and last point in meters
- total_duration_value - total travel time between first and last point
The following properties are used to configure the Get distance and travel time between points action:
- Type
The type of route to plot:
- StartAndEndAddress
Plot a route between two locations: a start address and end address.
- MultipleAddresses
Plot a route for two or more addresses defined using a JavaScript function.
- Start address
The starting address for the route. You can either enter address (e.g. '36 Bigelow St. Cambridge MA') or latitude/longitude values (comma delimited (e.g. 42.3685632,-71.1045822). You can also specify the name of a Javascript function to return the address. To use a Javascript function, specify the address as: javascript:name_of_your_function
- End address
The end address for the route. See Start address for how to specify the address.
- Addresses
The name of the JavaScript function to call that computes a list of addresses for the route. The addresses should be returned as an array. Each entry in the array can be either an address or latitude/longitude value. Latitude/longitude values must be comma delimited. For example, '42.480572,-71.204212'. Click here to download an example component that uses a List to populate the addresses.
- Travel mode
The travel mode to use. Can be "Driving", "Walking", or "Bicycling".
- Avoid highways
If checked, highways will be avoided when the route is generated.
- Avoid tolls
If checked, toll booths and toll roads will be avoided when the route is generated.
- Units
The distance units to use. Options include Default, Imperial, and Metric.
- onReady Javascript
JavaScript to execute after all the values have been computed. This is where you would add code to take the computed data and populate a control or DIV in the app to display the information.
Videos
Adding a Marker to a Map
In this video, we show how you can add a marker to a map.
Adding Multiple Markers to a Map
In this video, we show how you can add bulk markers to a map. When the user selects a state from a dropdown box, we show how to put a marker on the map for each airport in the selected state.
Adding Multiple Markers to a Map Control using Client-side Data
Action Javascript has an action to add multiple markers to a map. The data that defines the latitude/longitude for each marker on the map (and also for the marker titles, details etc). can either come from server-side data, or from client-side data.
In the case of server-side data you specify the name of a Data Series that specifies the properties for each marker.
In this video we show how to configure the Action Javascript 'Add multiple markers to a map' action to use client-side data. This client-side data can come from a Javascript function, a List control, the client-side Data Cache, or, in the case of a Cordova application, by querying a SQLite database on a device.
Computing Distance and Travel Time Between Points
A common requirement in mapping applications is to compute a route (showing driving directions, distance and travel time) between points.
In this video we show how a route, defined by addresses in a List control is used to compute driving directions, distance and travel times between points on the route. The code is all generated automatically by Action Javascript.
See Also